Cloud Control EM13c - Loader Throughput (rows per second) for Loader_D crossed the critical threshold and Total Loader Runtime in the Last Hour (seconds) for Loader_D crossed the critical threshold
Hello Guys,
Here is an another post related to Cloud Control EM13c - Real-time Scenario.
Suddenly We were receiving the following warning and critical alerts from EM13c Cloud Control during the time slot between 12 AM and 04:00 AM daily.
1) Message=Loader Throughput (rows per second) for Loader_D crossed the critical threshold (xx). Current value: xx.xx
2) Message=Total Loader Runtime in the Last Hour (seconds) for Loader_D crossed the critical threshold (x,xxx). Current value: xxxx.xx
3) ORA-error stack (3,136) and ORA-error stack (609) were also logged in alert log
4) Message=Incident (BEA-310003 [LowMemory]) detected in $OMS_HOME/gc_inst/user_projects/domains/GCDomain/servers/EMGC_OMS1/adr/diag/ofm/GCDomain/EMGC_OMS1/alert/log.xml at time/line number:
When we analyzed the AWR reports of EM PDB repository database, we found there were few PL/SQL statements given below causing this issue with wait event SQL*Net Break/reset To Client Waits.
SQL statement with SQL_ID 4p3rny0g5b2ua - wait event "SQL*Net
break/reset to client"
BEGIN
EM_NOTIF_PKG.QUEUE_READY(:1 , :2 , :3 ); END;
SQL statement with SQL_ID a9t927jdagvtt - wait event "SQL*Net
break/reset to client"
begin
em_event_bus.listen(:1 , :2 , :3 ); end;
SQL statement with SQL_ID aphss0yj5ygxx - wait event "SQL*Net
break/reset to client"
begin em_cntr_queue.listen(:1
, :2 , :3 ); end;
SQL statement with SQL_ID bafrnujjt7mgz - wait event "SQL*Net
break/reset to client"
BEGIN
EM_EVENT_BUS.DEQUEUE_ISSUE(:1 ,:2 ,:3 ,:4 ,:5 ,:6 ,:7 ,:8 ,:9 ,:10 ,:11 ); END;
SQL statement with SQL_ID f6g21156r5v3y - - wait event "enq: TX -
row lock contention"
SELECT
BLACKOUT_STATUS FROM EM_BLACKOUTS_NG WHERE BLACKOUT_GUID = :B1 FOR UPDATE;
So when we googled further more days, we found a solution on community forum.
Here
the situation differs but symptoms are same as our environment. A guy (working in ORACLE as
Framework developer) has correctly answered the question saying that “These
symptoms are only due to the lack of resources situation. So adjusting the Heap
Size should solve the problem”.
On the same day we got this solution, we received following critical alert on OMS HEAP USAGE also.
Target
type=Oracle WebLogic Server
Target name=/EMGC_GCDomain/GCDomain/EMGC_OMS1
Categories=Capacity
Message=The heap usage is 100%.
Severity=Critical
Target name=/EMGC_GCDomain/GCDomain/EMGC_OMS1
Categories=Capacity
Message=The heap usage is 100%.
Severity=Critical
Note:
The heap memory settings for the OMS are defined with the following properties:
OMS_HEAP_MAX
OMS_PERMGEN_ MIN
OMS_PERMGEN_MAX
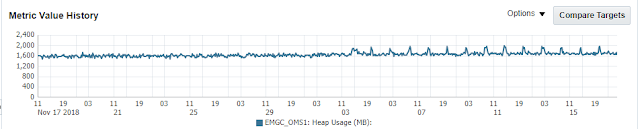
Then we checked the Heap usage graph in Cloud Control EM13c Console and it was also showing sudden increase in the problematic window for few days and it's because of more backlog request have been written at that time which requires more memory and also we have a medium environment according to EM deployment guide but allocated OMS_HEAP_MAX was 2GB only.
OMS HEAP USAGE GRAPH:

OMS_HEAP_MAX=2048M
Other parameter settings are same as mentioned in the EM deployment guide.
So we have decided to allocate 4GB of OMS_HEAP_MAX as per deployment guide by following below steps.
1) $OMS_HOME/bin/emctl set property -name <property_name> -value <number_followed_by_G_or_M>
For example:
$OMS_HOME/bin/emctl set property –name OMS_HEAP_MAX –value 4096M
Note: Values set using emctl command will override the values in the startEMServer.sh file.
And these parameters will carry forward whenever the OEM is upgraded.
2. Restart the oms to implement the changes
$ emctl stop oms -all
$ emctl start oms
After this change, we have not received any of the above mentioned alerts once again and OMS HEAP USAGE also became normal all the time.
For your information:
Current settings can be checked with the following commands:
$ emctl get property -name OMS_HEAP_MAX
$ emctl get property -name OMS_HEAP_MIN
$ emctl get property -name OMS_PERMGEN_ MIN
$ emctl get property -name OMS_PERMGEN_MAX
Note:
If user set the java memory arguments using JAVA_EM_MEM_ARGS parameter, that will override the memory settings for OMS as well as other EM integrated components such as BI Publisher.
For example, if you set Max Heap memory as 4GB using this parameter. OMS application sets with 4GB and BI Publisher with another 4GB.
Recommended to use the parameter JAVA_EM_MEM_ARGS only when OMS is not integrated with any other application.
Comments
Post a Comment